Leaders from all walks of life and experiences.
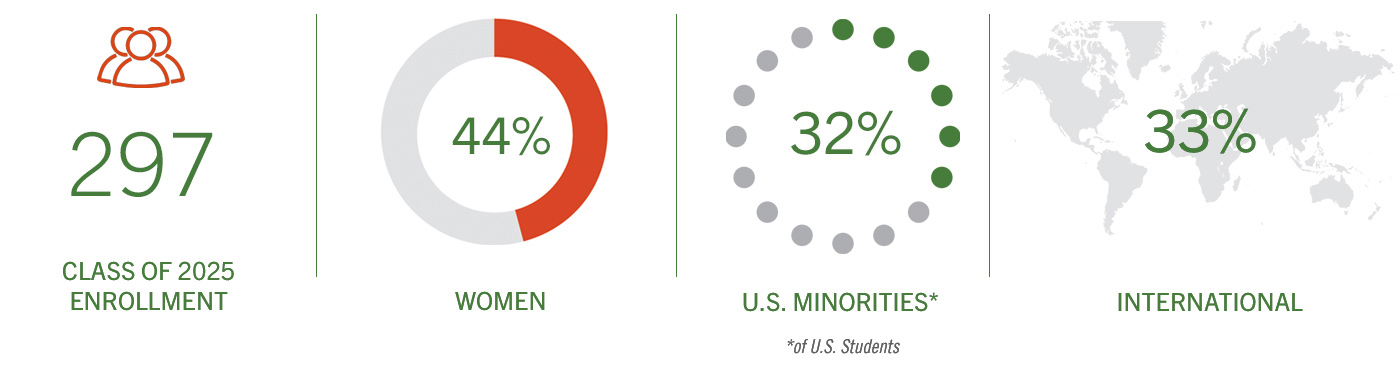
Bringing together a talented and dynamic student body is critical to our mission of educating tomorrow’s wise, decisive leaders. Tuck is enriched by the diverse backgrounds, experiences, and dreams of our students and strengthened by what they share: an exceptional record of accomplishment and a desire to use their talents to better the world through business.
Personal
| Women | 44% |
| Students with partners | 31% |
| Students with children | 5% |
| LGBTQ+ | 10% |
| First generation in their family to graduate from a four-year college or university | 19% |
U.S. Students
| U.S. minorities (All Students Denominator = 297) Includes American Indian, African American, Asian American, Hispanic/Latinx, Native Hawaiian |
21% |
| U.S. minorities (U.S. & Permanent Residents Denominator = 200) Includes American Indian, African American, Asian American, Hispanic/Latinx, Native Hawaiian |
32% |
| U.S. Underrepresented Minorities (U.S. Students Denominator = 199) Includes American Indian, African American, Hispanic/Latinx, Native Hawaiian |
12% |
| U.S. RACE/ETHNICITY | FEDERAL GUIDELINES REPORTING* | MULTI-DIMENSIONAL REPORTING** | |
| American Indian, Alaska Native, Native Hawaiian, or Other Pacific Islander | 0% | 2% | |
| Asian | 16% | 21% | |
| Black or African American | 5% | 6% | |
| Hispanic or Latinx | 6% | 6% | |
| White | 65% | 74% | |
| Multi-race/ethnic | 6% | - | |
| Did not report | 3% | 3% |
*Federal Reporting Guidelines
Students who identify as Hispanic / Latinx and any other race are represented as Hispanic / Latinx only. Students who identify with more than one race are represented as Multi-Race only.
**Multi-Dimensional Reporting Guidelines
Students with multi-racial or multi-ethnic identities are represented across the multiple categories with which they identify. As a result, the total may add to more than 100%.
International
| International | 33% | |
| Countries represented | ||
| By citizenship | 40 | |
| By birth | 22 | |
| By professional experience | 35 | |
| Citizenship Counts dual citizens in both countries |
||
| U.S.A. and Canada | 68% | |
| Asia | 21% | |
| Europe | 7% | |
| Latin America | 8% | |
| Middle East and Africa | 4% | |
| Oceania |
<1%
|
|
Academic
(based on institution awarding degree)
| Unique undergraduate majors | 73 | |
| Arts, humanities, social sciences | 40% | |
| Science, technology, engineering, math | 25% | |
| Business | 28% | |
| Unique undergraduate institutions | ||
| Domestic | 112 | |
| International | 69 | |
| Previous advanced degrees | 13% | |
GMAT
| Average | 726 |
| Verbal Average | 42 |
| Quant Average | 48 |
| IR Average | 7 |
| Range | 630-800 |
| Verbal Range | 31-51 |
| Quant Range | 39-51 |
GRE
| Verbal Average | 161 |
| Quant Average | 161 |
| Verbal Range | 152-170 |
| Quant Range | 149-170 |
| % Submitting GRE Scores | 42% |
GPA
3.49
Average
2.7-4.0
Range
Students from U.S. schools w/ 4.0 scale
Professional
261
Unique Employers
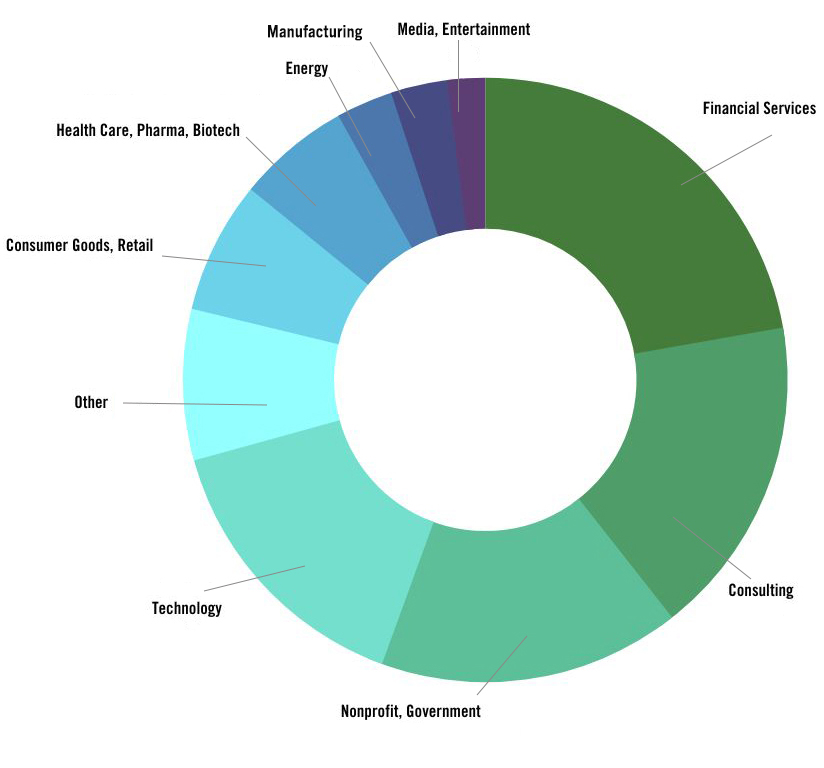
Industry Experience
(based on most recent employer)
22% Financial Services
17% Consulting
16% Nonprofit, Government
15% Technology
8% Other
7% Consumer Goods, Retail
6% Health Care, Pharma, Biotech
3% Energy
3% Manufacturing
2% Media, Entertainment
69 Average months worked
Results as of August 2023
![]()