Tuck graduates enjoy great career success.
Just as important, they also report a high degree of satisfaction with their post-MBA industry, function, location, and organization. These successes are a direct result of Tuck’s personal approach to management education and its best-in-class career services. The employment statistics for the Tuck Class of 2023 are available below.
Offers and Acceptances
Compensation
Tuck Class of 2023
| U.S. Permanent work authorization | Non-permanent work authorization (U.S.) | Total Full-Time MBA Graduates | ||||
| Graduates | Students | Percent | Students | Percent | Students | Percent |
| Seeking Employment | 175 | 85% | 86 | 97% | 261 | 88% |
| Not Seeking Employment | 31 | 15% | 3 | 3% | 34 | 12% |
| Company-sponsored; already employed | 14 | 7% | 2 | 2% | 16 | 5% |
| Continuing Education | 4 | 2% | 0 | 0% | 4 | 1% |
| Postponing Job Search | 0 | 0% | 0 | 0% | 0 | 0% |
| Starting a new business | 8 | 4% | 0 | 0% | 8 | 3% |
| Not seeking for other reasons | 5 | 2% | 1 | 1% | 6 | 2% |
| No Recent Information Available | 0 | 0% | 0 | 0% | 0 | 0% |
| Total graduates | 206 | 100% | 89 | 100% | 295 | 100% |
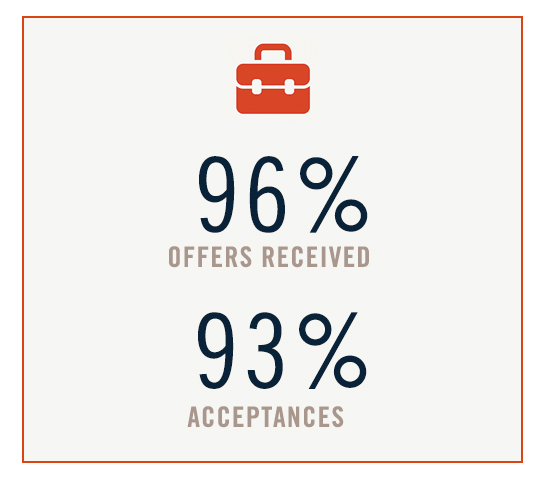
Offers and Acceptances by 3 Months after Graduation
| Offers | Acceptances | ||||
| Graduates | Students Seeking Jobs | Students | Percent | Students | Percent |
| U.S. Permanent work authorization | 175 | 166 | 95% | 160 | 91% |
| Non-permanent work authorization (U.S.) | 86 | 84 | 98% | 82 | 95% |
| Total graduates seeking jobs | 261 | 250 | 96% | 242 | 93% |
The graduation date for the full-time MBA class of 2023 was June 11, 2023.
Placement and Compensation Summary
Compensation information is self-reported. Salary data was obtained from 90% of those graduates who were seeking employment and accepted a job offer by 3 months after graduation.
Base Compensation by Industry
| Industry | Percent | Median | Base Salary Range | Percent Receiving Signing Bonus | Median Signing Bonus | Signing Bonus Range |
| Consulting | 46% | $190,000 | $112,372 - $195,000 | 83% | $30,000 | $10,000 - $60,000 |
| Financial services | 23% | $175,000 | $100,000 - $275,000 | 89% | $50,000 | $5,000 - $110,000 |
| Investment banking | 14% | $175,000 | $129,052 - $200,000 | 94% | $53,800 | $40,000 - $60,000 |
| Investment management | 3% | $150,000 | $100,000 - $180,000 | 71% | $40,000 | $30,000 - $110,000 |
| Other | 2% | $164,500 | $149,000 - $171,000 | 100% | $37,500 | $35,000 - $50,000 |
| Private equity, venture capital | 3% | $175,000 | $135,000 - $275,000 | 80% | $10,000 | $5,000 - $20,000 |
| Technology | 14% | $160,500 | $126,000 - $212,500 | 82% | $35,000 | $2,599 - $193,700 |
| Health care, pharma, biotech | 6% | $135,000 | $105,000 - $155,000 | 83% | $35,000 | $25,000 - $80,000 |
| Consumer goods, retail | 6% | $128,000 | $113,000 - $150,000 | 71% | $30,000 | $7,000 - $40,000 |
| Energy | 2% | $152,500 | $130,000 - $170,000 | 100% | $25,000 | $5,000 - $40,000 |
| Manufacturing | 2% | $137,500 | $130,000 - $195,000 | 100% | $35,000 | $20,000 - $35,000 |
| Real estate | 1% | $150,000 | $140,000 - $160,000 | 67% | * | * |
| Government, nonprofit, education | 1% | * | * | 50% | * | * |
| Media, entertainment, sports | 1% | * | * | 0% | * | * |
| Transportation | 1% | * | * | 0% | * | * |
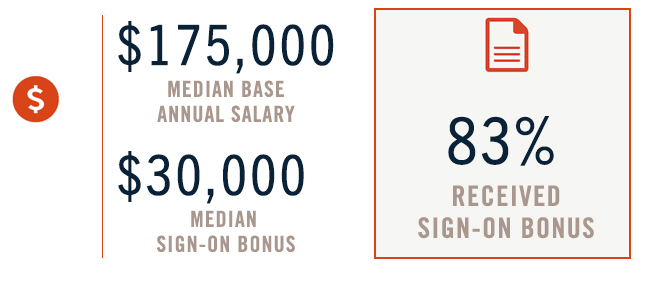
| All industries | 100% | $175,000 | $100,000 - $275,000 | 83% | $30,000 | $2,599 - $193,700 |
Values are excluded where the sample size is too small. Values that are greater than 0 but less than 1 are rounded to show presence.
Totals may not add to 100 due to rounding.
All data as of October 2023.
Base Compensation by Function
| Function | Percent | Median | Base Salary Range | Percent Receiving Signing Bonus | Median Signing Bonus | Signing Bonus Range |
| Consulting | 49% | $190,000 | $112,372 - $195,000 | 82% | $30,000 | $10,000 - $60,000 |
| Finance | 21% | $175,000 | $100,000 - $275,000 | 86% | $50,000 | $5,000 - $110,000 |
| Investment banking | 14% | $175,000 | $129,052 - $200,000 | 93% | $53,800 | $40,000 - $60,000 |
| Private equity, venture capital | 3% | $162,500 | $135,000 - $275,000 | 67% | $10,000 | $5,000 - $20,000 |
| Investment management | 2% | $150,000 | $150,000 - $180,000 | 100% | $40,000 | $30,000 - $110,000 |
| Other | 2% | $140,000 | $100,000 - $150,000 | 33% | * | * |
| Corporate finance | 1% | $175,000 | $170,000 - $190,000 | 100% | $25,000 | $20,000 - $60,000 |
| Marketing | 11% | $146,400 | $105,144 - $192,000 | 70% | $37,500 | $5,000 - $120,000 |
| General management | 8% | $140,000 | $105,000 - $212,500 | 88% | $35,000 | $7,000 - $80,000 |
| Other | 6% | $156,000 | $105,000 - $186,000 | 93% | $35,000 | $2,599 - $193,700 |
| Operations, logistics | 4% | $137,500 | $120,981 - $155,000 | 100% | $30,000 | $22,561 - $55,000 |
| Information technology | 1% | * | * | 50% | * | * |
| All functions | 100% | $175,000 | $100,000 - $275,000 | 83% | $30,000 | $2,599 - $193,700 |
Values are excluded where the sample size is too small. Values that are greater than 0 but less than 1 are rounded to show presence.
Totals may not add to 100 due to rounding.
All data as of October 2023.
Base Compensation by Location
| Percent | Median Base Salary | Base Salary Range | |
| United States | 95% | $175,000 | $100,000 - $275,000 |
| Northeast (CT, ME, MA, NH, NJ, NY, RI, VT) | 53% | $175,000 | $100,000 - $275,000 |
| New York | 28% | $175,000 | $113,000 - $275,000 |
| Boston | 24% | $190,000 | $100,000 - $195,000 |
| Other | 1% | $135,000 | $135,000 - $165,000 |
| West (AK, CA, HI, ID, MT, NV, OR, UT, WA, WY) | 14% | $175,000 | $126,000 - $192,000 |
| San Francisco | 6% | $175,000 | $142,800 - $190,000 |
| Seattle | 5% | $190,000 | $126,000 - $192,000 |
| Other | 3% | $172,500 | $130,000 - $192,000 |
| Midwest (IL, IN, IA, KS, MI, MN, MO, NE, ND, OH, SD, WI) | 10% | $170,500 | $105,000 - $195,000 |
| Chicago | 8% | $171,000 | $128,000 - $192,000 |
| Other | 2% | $150,000 | $105,000 - $195,000 |
| Southwest (AZ, CO, NM, OK, TX) | 8% | $182,500 | $130,000 - $192,000 |
| South (AL, AR, FL, GA, KY, LA, MS, NC, SC, TN) | 6% | $192,000 | $130,000 - $212,500 |
| Mid-Atlantic (DC, DE, MD, PA, VA, WV) | 5% | $170,500 | $145,000 - $192,000 |
| Outside U.S. | 5% | $120,981 | $105,144 - $182,000 |
| Europe | 2% | $112,652 | $105,144 - $129,052 |
| Asia | 2% | $139,947 | $120,981 - $182,000 |
| Latin America & the Caribbean | 1% | * | * |
| Canada | 1% | * | * |
| All locations | 100% | $175,000 | $100,000 - $275,000 |
Values are excluded where the sample size is too small. Values that are greater than 0 but less than 1 are rounded to show presence. Totals may not add to 100 due to rounding.
City names listed include the surrounding metropolitan areas.
Location reported includes both in-person and remote work.
All data as of October 2023.
Top Hiring Companies